
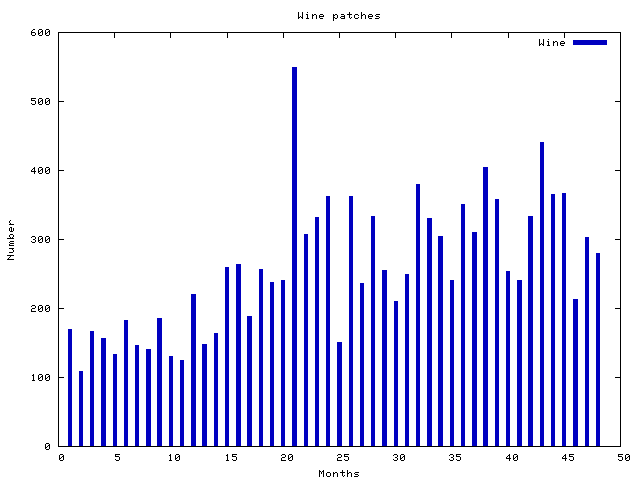
Fellow bean counters! On the weekend I wrote a quick script to generate a graph of the number of patches committed to the Wine CVS per month. The script and the graph it generates are attached. Anybody think it would be interesting to have a page of similar graphs on WineHQ somewhere that's regenerated once a month? Some ideas: patches committed to winehq per month patches sent to wine-patches per month unique patch authors vs. months lines of code committed per month lines of code sent per month ... Mike Dept of Time Wasting and (Mostly) Useless Statistics #!/usr/bin/perl # filename : winestat.pl # author : Mike McCormack # # A script to generate a graph with the number of patches against Wine per month. use strict; sub make_stat($) { my $month=$_[0]; my $winepatches=0; my $appdbpatches=0; my $lostwagespatches=0; my $cmd = sprintf("wget -q -O - http://www.winehq.org/hypermail/wine-cvs/%d.%02d.txt",$month/12 + 2001,$month%12+1); #print "$cmd\n"; open(IN,"$cmd|") || die "failed to run wget\n"; while(<IN>) { #print $_; if ( s/^Subject: *// ) { #print $_; if ( /^wine/ ) { $winepatches++; } elsif ( /^lostwages/ ) { $lostwagespatches++; } elsif ( /^appdb/ ) { $appdbpatches++; } else { #print "unknown module $_\n"; } } } printf(OUT "%d %3d %3d %3d\n", $month, $winepatches, $lostwagespatches, $appdbpatches); close IN; } my $month; open(OUT, ">stat"); for($month=1; $month<=(12*4+1); $month++) { make_stat($month); } close OUT; # <mike_m> it'd be nice to figure out how to get the x axis to display the date nicely # <papineau> set xdata time open (GNUPLOT, "|gnuplot"); print GNUPLOT "set title \"Wine patches\"\n"; print GNUPLOT "set xlabel \"Months\"\n"; print GNUPLOT "set ylabel \"Number\"\n"; print GNUPLOT "set term png xffffff x000000 x404040 x0000c0 xffa500 x66cdaa xcdb5cd\n"; print GNUPLOT "set boxwidth 0.3\n"; print GNUPLOT "set output \"winestat.png\"\n"; print GNUPLOT "plot \"stat\" using 1:2 title \"Wine\" w boxes fs solid 1\n"; #print GNUPLOT "plot \"stat\" using 1:2 title \"Wine\" w boxes fs solid 1, \\\n"; #print GNUPLOT " \"stat\" using 1:3 title \"Appdb\" w boxes fs solid 2, \\\n"; #print GNUPLOT " \"stat\" using 1:4 title \"LostWages\" w boxes fs solid 3 \n"; close GNUPLOT;
participants (1)
-
 Mike McCormack